This blog post covers the first part of an environmental monitoring system I built around a SEN66 sensor. The sensor platform has the capability to measure PM, RH/T, VOC, NOx and CO2 and would be the perfect addition to my homelab setup.
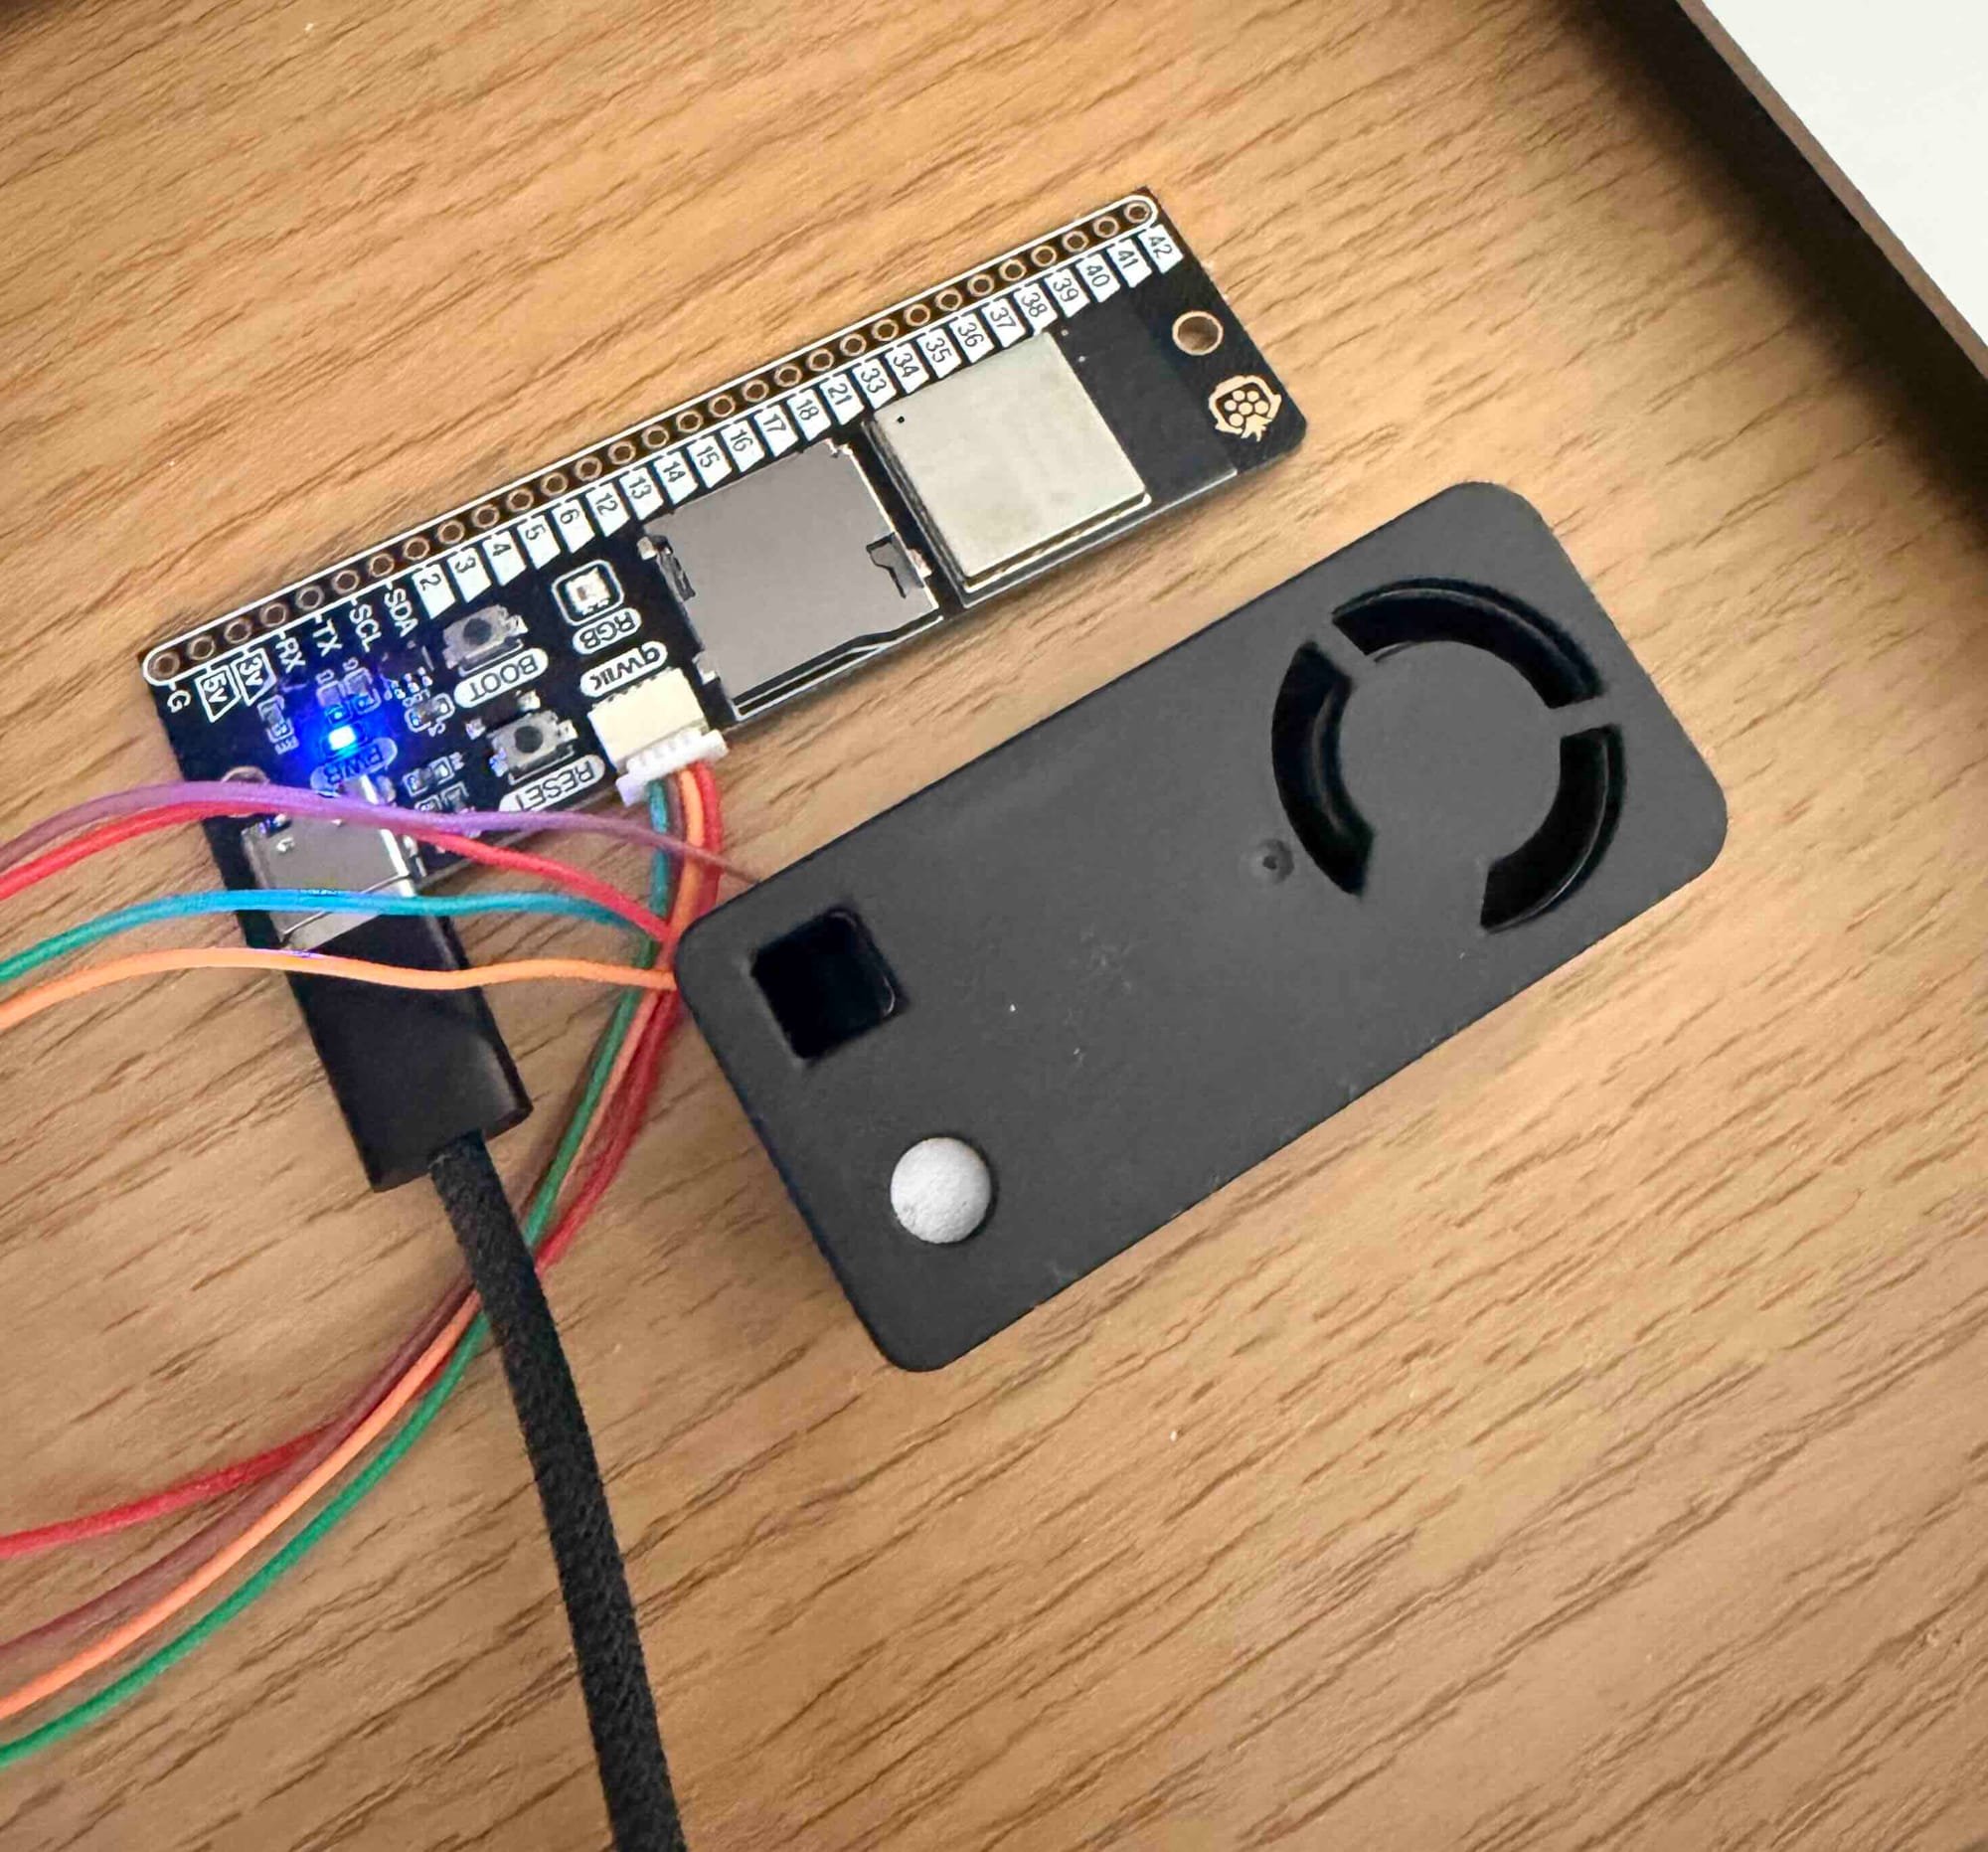
The BoM (Bill of Materials)
The initial bill of materials was overspec'd, and one breakout board I purchased is currently not used.
- Sensirion SEN66 Environmental Sensor Node
- Baguette S3 - ESP32-S3 Prototyping Board
- JST GH 6 pin to JST SH Qwiic 4 pin cable
I chose the Baguette S3 board for 2 reasons: it has a local micro-SD slot, meaning that I could use it for another project I have planned in the future, or an offline temperature sensor, and it also has a 4 pin Qwiic connector.
I had originally planned to use the SEN66 breakout board. However, due to the lack of availability of a pre-made 6 pin JST-GH cable at an affordable price, I bought a kit and made my own cable, meaning that the Adafruit SEN6x Breakout for Sensirion SEN66 I had planned to use was not necessary.
The 6 pin JST GH to 4 pin JST SH cable
The SEN66 sensor's connector breaks out as:
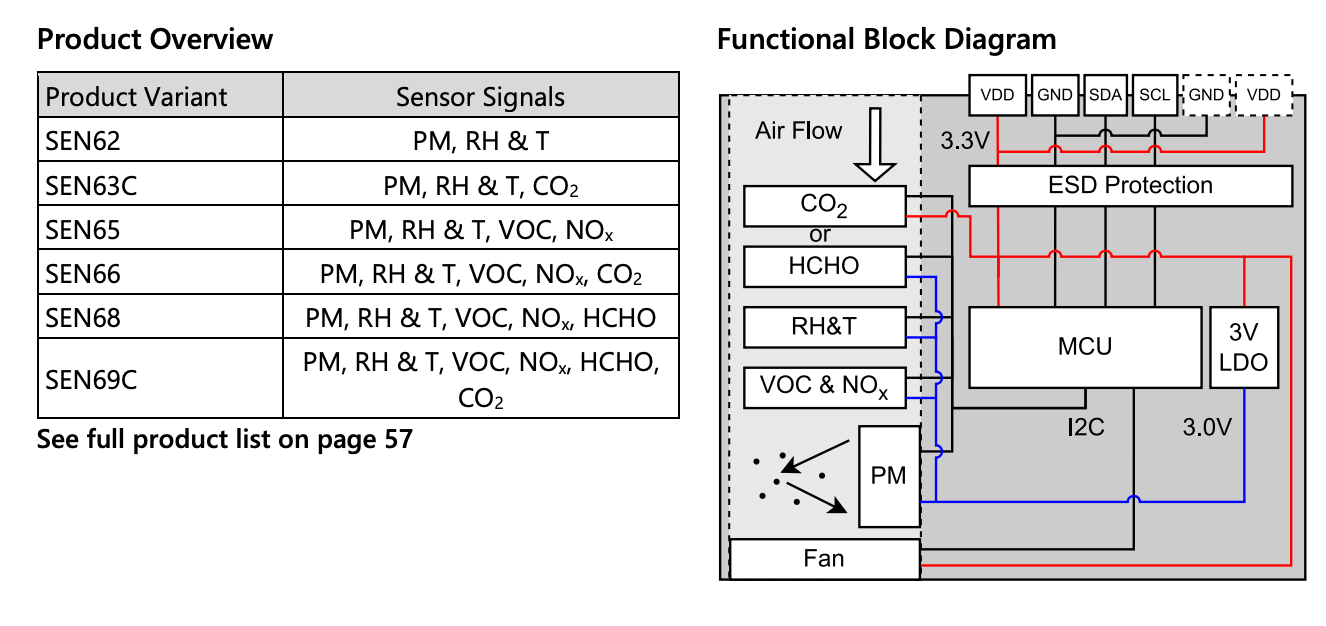
- Pin 1 VDD (supply voltage)
- Pin 2 GND (ground)
- Pin 3 SDA (serial data)
- Pin 4 SCL (serial clock)
- Pin 5 second GND
- Pin 6 Second VDD
Whereas the Qwiic connector has a pinout like this:
- Pin 1 GND
- Pin 2 3V3
- Pin 3 SDA
- Pin 4 SCL
The cable is a fairly simple build with a simple crossover for GND and VCC for the two different pinouts:
SEN66           Qwiic
=====================
VDD 1 -- \/ -- 1 GND
GND 2 -- /\ -- 2 VDD
SDA 3 -- -- -- 3 SDA
SCL 4 -- -- -- 4 SCL
GND 5 -- NC
VCC 6 -- NC
Pinout and cable diagram
SEN66 Driver and Firmware
The SEN66 can be driven with quite a simple interface:
#pragma once

#include <stdbool.h>

#include "driver/i2c_master.h"
#include "esp_err.h"

typedef struct {
    i2c_master_dev_handle_t dev;
} sen66_t;

typedef struct {
    float pm1_0_ugm3;
    float pm2_5_ugm3;
    float pm4_0_ugm3;
    float pm10_ugm3;
    float humidity_pct;
    float temperature_c;
    float voc_index;
    float nox_index;
    float co2_ppm;
} sen66_reading_t;

/* Resets the sensor */
esp_err_t sen66_init(sen66_t *sensor, i2c_master_bus_handle_t bus);

/* Starts continuous measurement */
esp_err_t sen66_start_measurement(sen66_t *sensor);

/* Stops measurement and spins the fan down */
esp_err_t sen66_stop_measurement(sen66_t *sensor);

esp_err_t sen66_read_data_ready(sen66_t *sensor, bool *ready);

esp_err_t sen66_read_measured_values(sen66_t *sensor, sen66_reading_t *reading);
And similarly the driver itself is also straightforward. I will document the full code on Github. But it should be possible to reconstruct this with your favourite LLM tooling too. The core part of the implementation is the set of I2C commands that we need to send over the I2C buss.
/* Documented in Sensirion SEN6x datasheet, section "I2C commands". */
#define SEN66_I2C_ADDRESS 0x6B
#define SEN66_CMD_START_MEASUREMENT 0x0021
#define SEN66_CMD_STOP_MEASUREMENT 0x0104
#define SEN66_CMD_GET_DATA_READY 0x0202
#define SEN66_CMD_READ_MEASURED_VALUES 0x0300
#define SEN66_CMD_GET_PRODUCT_NAME 0xD014
#define SEN66_CMD_DEVICE_RESET 0xD304

/* Command execution times from the datasheet command table. */
#define SEN66_DELAY_START_MS 50
#define SEN66_DELAY_STOP_MS 1400
#define SEN66_DELAY_READ_MS 20
#define SEN66_DELAY_RESET_MS 1200

/* Values the sensor returns while a field is not yet available. */
#define SEN66_UNKNOWN_U16 0xFFFF
#define SEN66_UNKNOWN_I16 0x7FFF

#define I2C_TIMEOUT_MS 100

static const char *TAG = "sen66";

static esp_err_t send_command(sen66_t *sensor, uint16_t command, uint32_t exec_time_ms)
{
    const uint8_t buffer[2] = {command >> 8, command & 0xFF};
    ESP_RETURN_ON_ERROR(i2c_master_transmit(sensor->dev, buffer, sizeof(buffer), I2C_TIMEOUT_MS), TAG,
                        "send command 0x%04X", command);
    if (exec_time_ms > 0) {
        vTaskDelay(pdMS_TO_TICKS(exec_time_ms));
    }
    return ESP_OK;
}

/* Sends a read command, waits its execution time, then reads `count` 16-bit
 * words, each followed on the wire by a CRC byte. */
static esp_err_t read_words(sen66_t *sensor, uint16_t command, uint16_t *words, size_t count)
{
    uint8_t buffer[3 * 16];
    const size_t length = 3 * count;
    if (length > sizeof(buffer)) {
        return ESP_ERR_INVALID_ARG;
    }

    ESP_RETURN_ON_ERROR(send_command(sensor, command, SEN66_DELAY_READ_MS), TAG, "read 0x%04X", command);
    ESP_RETURN_ON_ERROR(i2c_master_receive(sensor->dev, buffer, length, I2C_TIMEOUT_MS), TAG, "receive 0x%04X",
                        command);

    for (size_t i = 0; i < count; i++) {
        const uint8_t *word = &buffer[3 * i];
        if (crc8(word, 2) != word[2]) {
            ESP_LOGE(TAG, "CRC mismatch in response to command 0x%04X (word %zu)", command, i);
            return ESP_ERR_INVALID_CRC;
        }
        words[i] = (uint16_t)(word[0] << 8 | word[1]);
    }
    return ESP_OK;
}
With this machinery to send/read over I2C, init and measurement become calls like this:
esp_err_t sen66_read_measured_values(sen66_t *sensor, sen66_reading_t *reading)
{
    uint16_t words[9];
    ESP_RETURN_ON_ERROR(read_words(sensor, SEN66_CMD_READ_MEASURED_VALUES, words, 9), TAG, "read measured values");

    reading->pm1_0_ugm3 = scale_u16(words[0], 10.0f);
    reading->pm2_5_ugm3 = scale_u16(words[1], 10.0f);
    reading->pm4_0_ugm3 = scale_u16(words[2], 10.0f);
    reading->pm10_ugm3 = scale_u16(words[3], 10.0f);
    reading->humidity_pct = scale_i16(words[4], 100.0f);
    reading->temperature_c = scale_i16(words[5], 200.0f);
    reading->voc_index = scale_i16(words[6], 10.0f);
    reading->nox_index = scale_i16(words[7], 10.0f);
    reading->co2_ppm = scale_u16(words[8], 1.0f);
    return ESP_OK;
}
Reporting Measured Values with Grafana
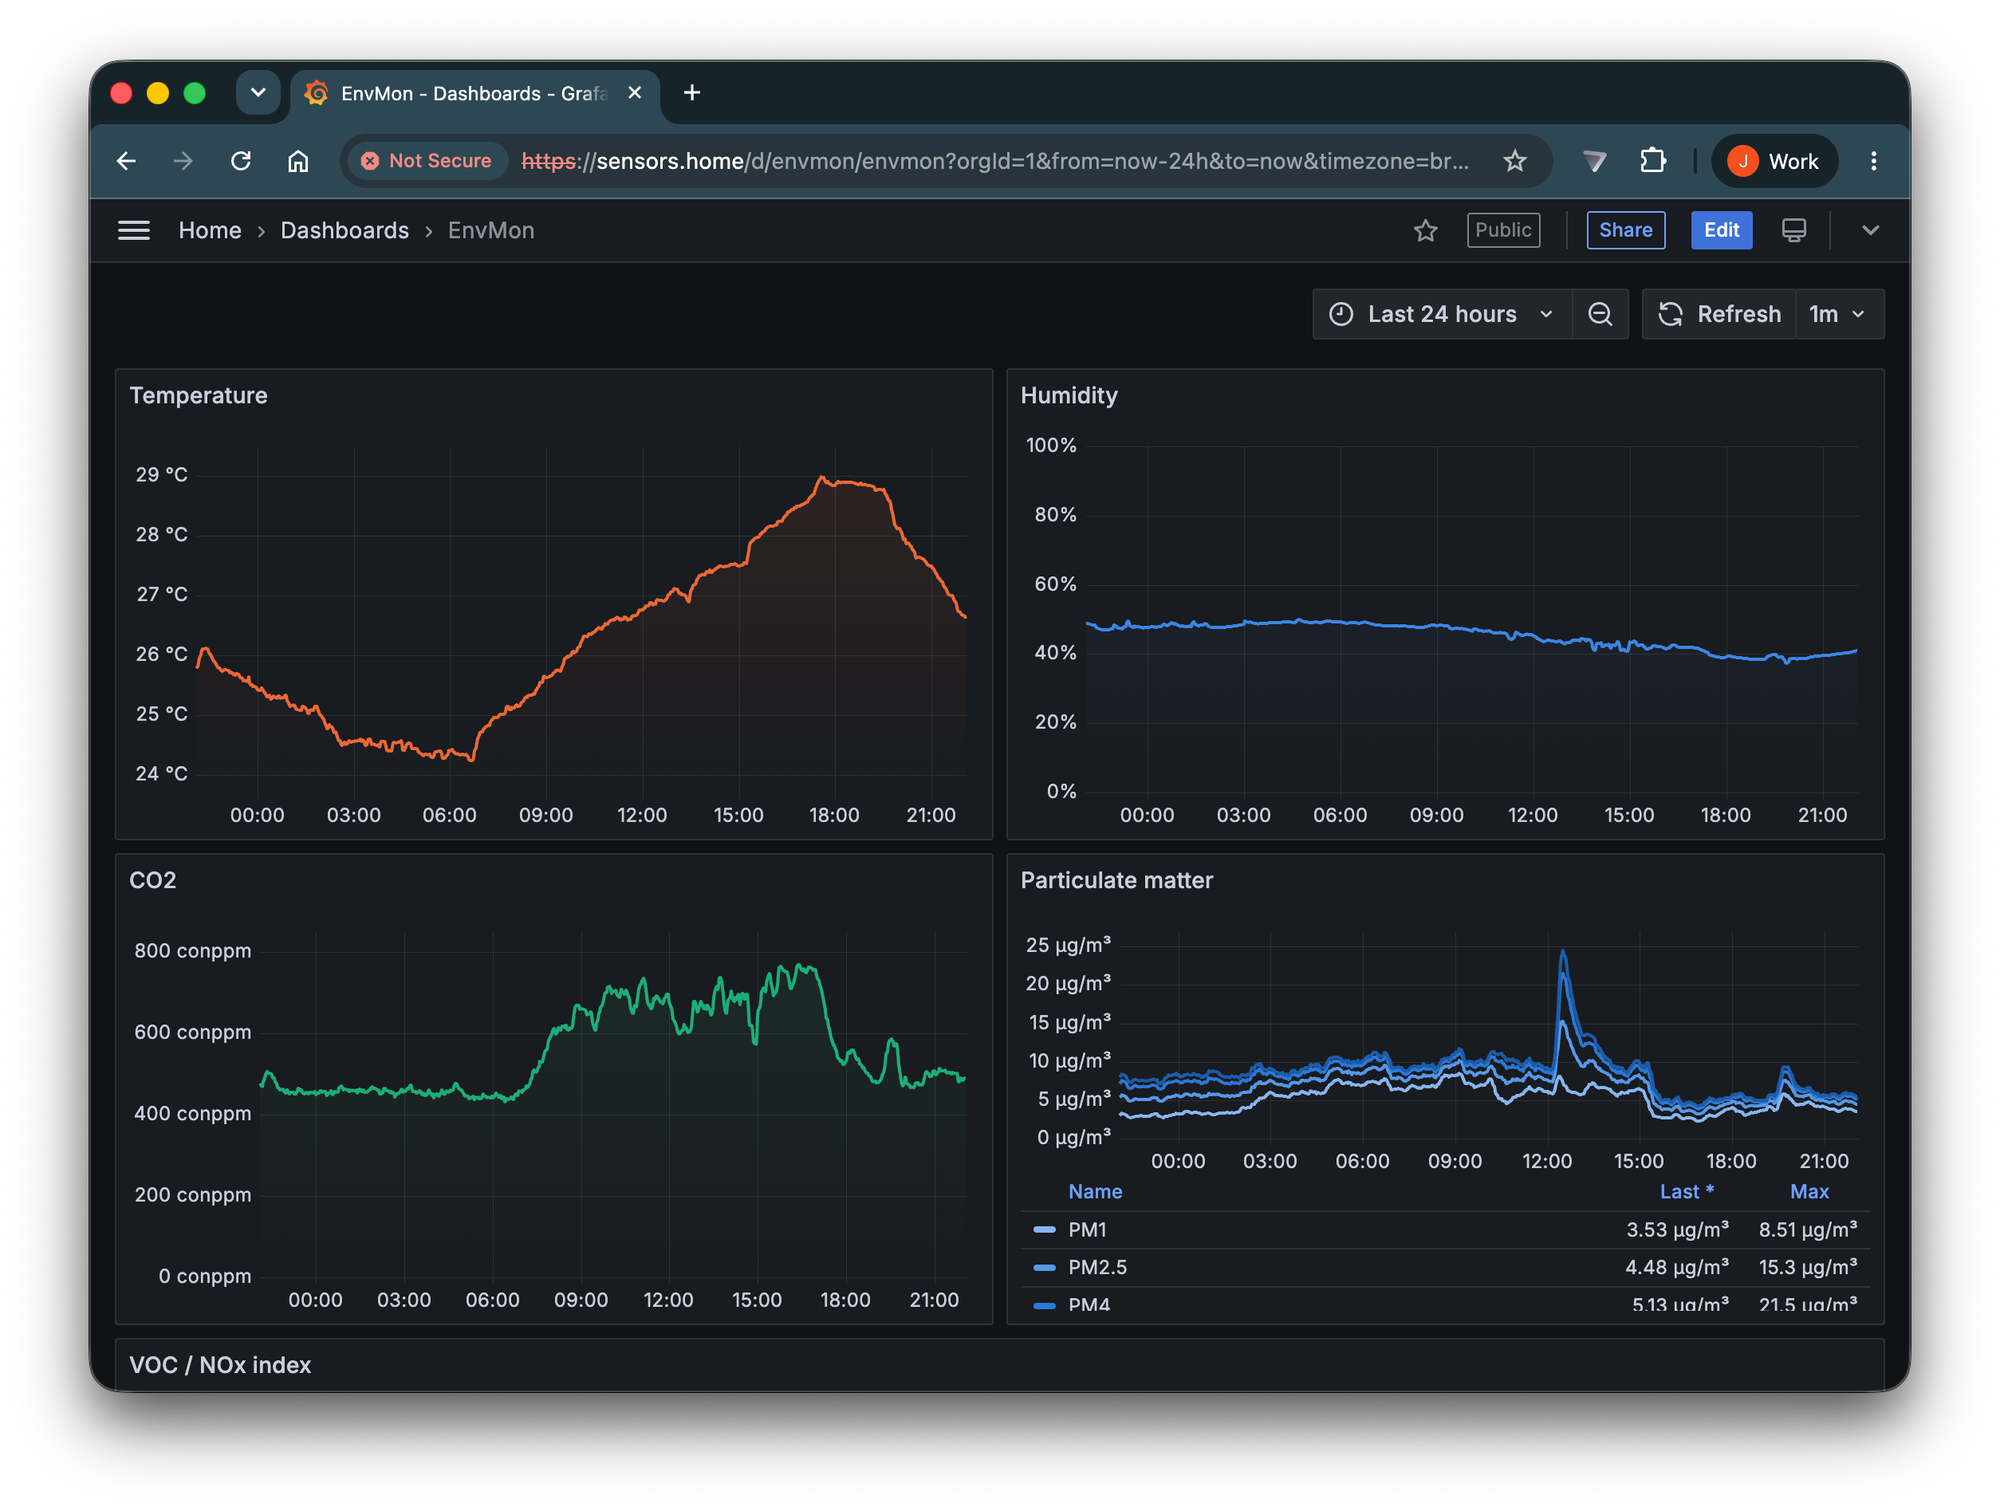
I have configured the ESP32 to POST values via HTTPS to a server running on my home network. I use Python with FastAPI to write readings into a Postgres table using sqlalchemy.
class ReadingRecord(Base):
    """One persisted per SEN66 reading."""

    __tablename__ = "readings"

    id: Mapped[int] = mapped_column(primary_key=True)
    device_id: Mapped[str] = mapped_column(String(64), index=True)
    recorded_at: Mapped[datetime] = mapped_column(DateTime(timezone=True), server_default=func.now(), index=True)
    temperature_c: Mapped[float | None] = mapped_column(Float)
    humidity_pct: Mapped[float | None] = mapped_column(Float)
    pm1_0_ugm3: Mapped[float | None] = mapped_column(Float)
    pm2_5_ugm3: Mapped[float | None] = mapped_column(Float)
    pm4_0_ugm3: Mapped[float | None] = mapped_column(Float)
    pm10_ugm3: Mapped[float | None] = mapped_column(Float)
    voc_index: Mapped[float | None] = mapped_column(Float)
    nox_index: Mapped[float | None] = mapped_column(Float)
    co2_ppm: Mapped[float | None] = mapped_column(Float)
The router itself is quite simple, relying on Pydantic for validating the input request:
class Reading(BaseModel):
    """One SEN66 reading. Fields the sensor has not settled arrive as null."""

    device_id: str = Field(min_length=1, max_length=64, pattern=r"^[A-Za-z0-9_-]+$")
    temperature_c: float | None = Field(default=None, ge=-90, le=90)
    humidity_pct: float | None = Field(default=None, ge=0, le=100)
    pm1_0_ugm3: float | None = Field(default=None, ge=0, le=10000)
    pm2_5_ugm3: float | None = Field(default=None, ge=0, le=10000)
    pm4_0_ugm3: float | None = Field(default=None, ge=0, le=10000)
    pm10_ugm3: float | None = Field(default=None, ge=0, le=10000)
    voc_index: float | None = Field(default=None, ge=0, le=500)
    nox_index: float | None = Field(default=None, ge=0, le=500)
    co2_ppm: float | None = Field(default=None, ge=0, le=40000)


@app.post("/v1/readings", status_code=status.HTTP_202_ACCEPTED, dependencies=[Depends(require_device_secret)])
async def post_reading(reading: Reading, session: AsyncSession = Depends(get_session)) -> dict[str, str]:
    logger.info("Reading from %s: %s", reading.device_id, reading.model_dump(exclude={"device_id"}))
    session.add(ReadingRecord(**reading.model_dump()))
    await session.commit()
    return {"status": "accepted"}
Grafana is configured to display dasboards, using this readings table in Postgres as the source.
The Grafana instance and API are hosted locally, all *.home DNS requests are resolved to a proxy layer running quik. This allows me to quickly spin up services and call these to a backend running on Docker
[[upstreams]]
name = "sensors"
members = [{ address = "envmon-backend:8000", "scheme" = "http" }]

[[upstreams]]
name = "grafana"
members = [{ address = "envmon-grafana:3000", "scheme" = "http" }]

[[routes]]
hosts = ["api.sensors.home"]
path_prefix = "/"
upstream = "sensors"

[[routes]]
hosts = ["sensors.home"]
path_prefix = "/"
preserve_host = true
upstream = "grafana"
This is it. This would be enough to host Grafana on https://sensors.home and get started! I will share the specifics and full code on Github once everything is settled and stable. Please feel free to reach out if you have any questions!